Observability: Giving the Agent a Telescope Into Its Own Machinery
About harness9
harness9 is a Local-First, lightweight, feature-complete, production-ready general-purpose Agent framework for Go.
⭐ Stars are the most direct way to support open-source work — Issues and PRs are welcome.
TL;DR
- The Span tree has exactly four layers:
harness9.interaction → harness9.turn → harness9.llm_request / harness9.tool, each one mapping to a real execution phase of the Agent Engine, not an arbitrarily invented hierarchy - Observability is wired in through three interfaces that already existed —
EngineObserver,LLMProvider, andToolHook— not a single line of the core engine was changed - The 6 Metrics fall into two categories: durations use Histogram (to see the distribution), counts use Counter (to see the running total); the two tool-related metrics also carry "tool name + success/failure" as labels, so you can slice the data by dimension
- Langfuse is a platform purpose-built for observability in LLM applications; once it's connected, every Agent run automatically turns into an expandable timeline, and it computes how much that conversation cost in real money
- Langfuse's attribute names matter: get the names right and the data shows up in the UI; get them wrong and the data still gets reported, but nothing renders on screen
What you'll learn from this post
- Which stage of the engine's execution each of the four nested Span layers maps to, and how the parent-child relationships are threaded together
- How the three pre-existing interfaces were repurposed to carry observability logic, and why that's better than editing the core code directly
- How the 6 Metrics are categorized, and when to use Counter versus Histogram for each type
- What Langfuse actually is, what problem it solves, and why harness9 chose it
- How to name attributes so Langfuse recognizes them, and how token cost gets computed automatically
First, a look at what a Trace looks like
Run an Agent task with harness9 hooked up to Langfuse, and what you see is a tree that looks like this:
harness9.interaction   [session.id="abc123"]
│
├── harness9.turn   [Turn 1]
│   ├── harness9.llm_request   [one LLM call, so many tokens used]
│   ├── harness9.tool   [bash executed, succeeded]
│   └── harness9.tool   [read_file executed, succeeded]
│
└── harness9.turn   [Turn 2]
    └── harness9.llm_request   [...]
How this tree grows, who draws each layer, and how Langfuse renders it into a clickable timeline — that's everything this post is about.
The layers of the Span tree
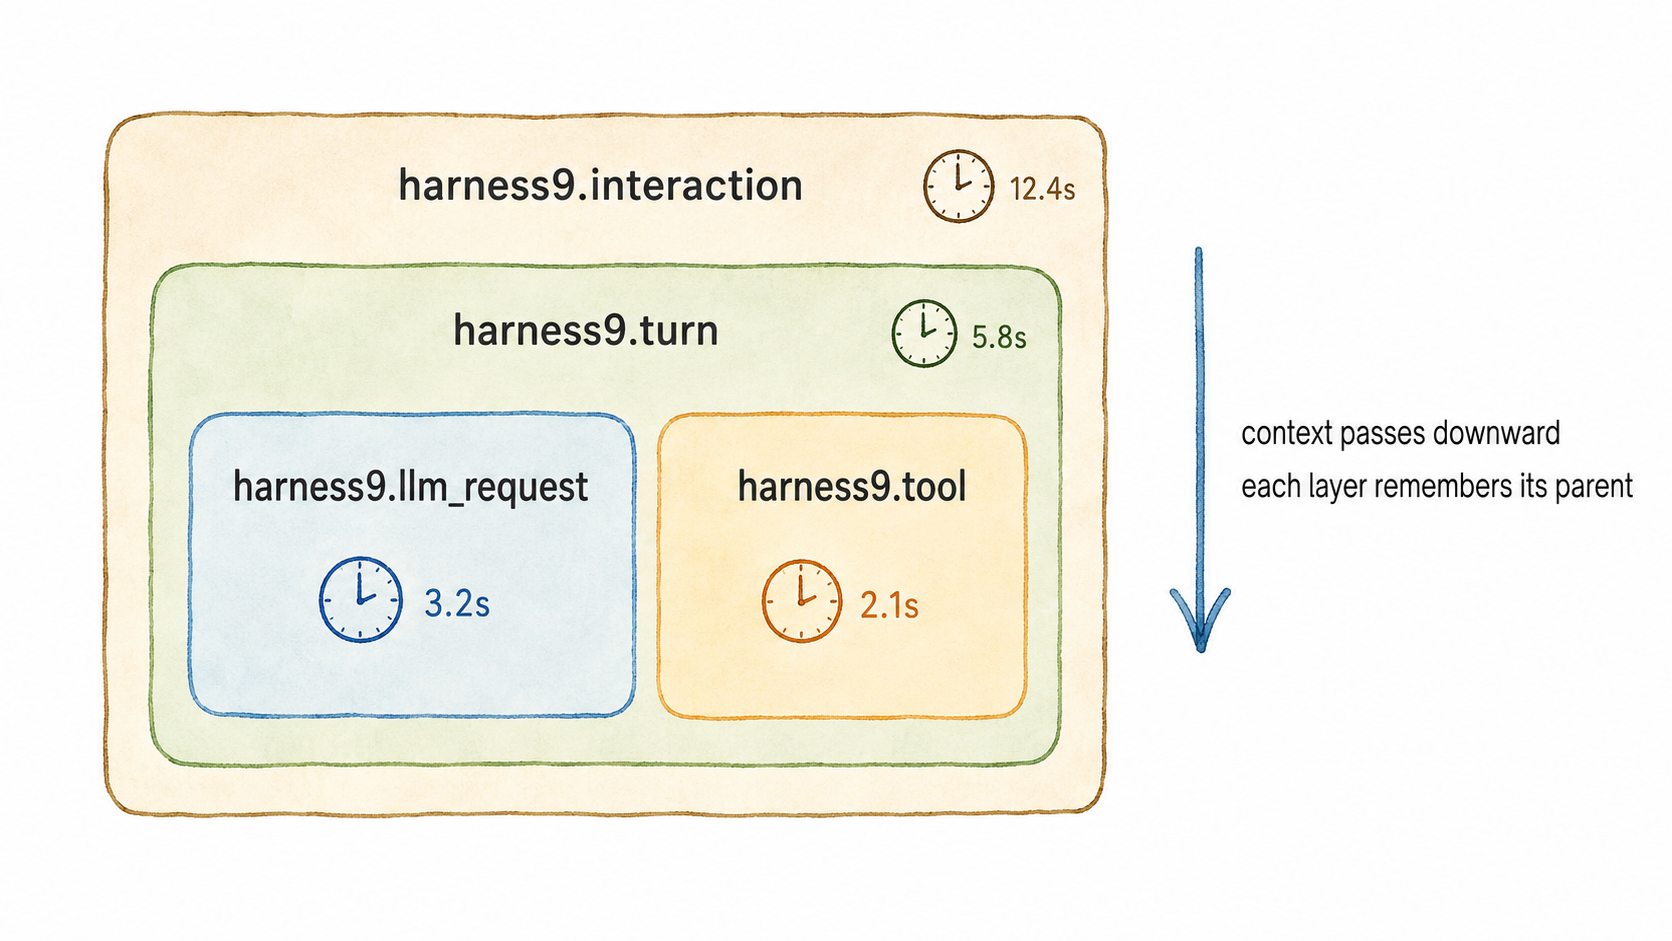
Break down a single Agent run and there are naturally only four stages: one complete conversation, each turn within that conversation, the one LLM call made in each turn, and each tool executed within that turn. harness9's Span hierarchy is drawn directly from these four stages — no more, no less:
| Span | Which engine stage it maps to |
|---|---|
harness9.interaction | The entire process, from the user's message to the Agent's final result |
harness9.turn | One turn of the ReAct Loop: one LLM call plus whatever tool executions it triggers |
harness9.llm_request | One concrete LLM API call |
harness9.tool | One concrete tool execution |
Going any deeper gets into HTTP request internals, which isn't worth splitting out; merging interaction and turn together, on the other hand, would make it impossible to answer the single most common question — "which turn got slow?" Four layers sits exactly at the line between "meaningful" and "unnecessary."
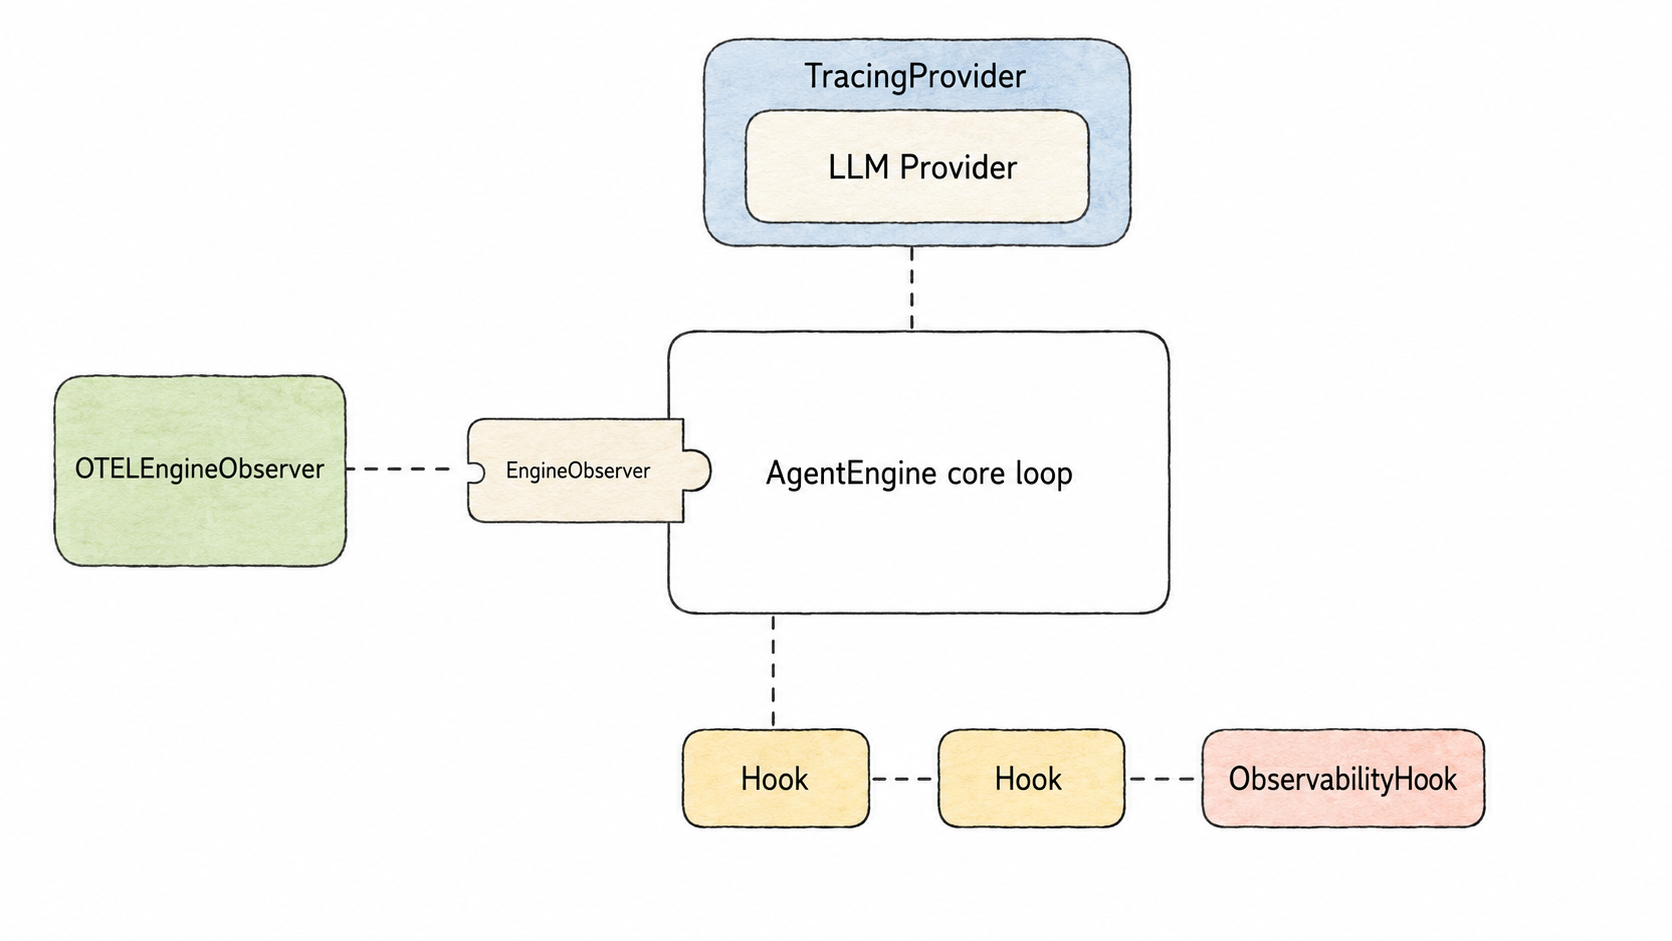
These four Span layers are created by three different components at three different moments: interaction and turn are created by something called OTELEngineObserver at the start/end of the loop; llm_request is created by TracingProvider, which wraps the LLM call; and tool is created by ObservabilityHook before and after each tool execution. They form a single coherent tree because Go's context.Context is threaded all the way down — when a layer creates a Span, it records it into the ctx; when the next layer creates its own Span, it discovers "there's already a Span up there" in the ctx and automatically adopts it as the parent.
The one thing to watch out for: harness9's engine has logic in the middle — like "compact conversation history" or "load session" — that can inadvertently swap out the ctx. To keep this from silently breaking the parent-child chain, OTELEngineObserver keeps a backup copy alongside the ctx it passes down; before the next layer creates a Span, it checks whether that backup is still there, and restores it if not. In short: keep an extra copy of anything critical, in case it gets lost along the way.
Non-invasive observability
The laziest way to add observability to a system is to sprinkle instrumentation code at every key point — a snippet before and after each LLM call, a snippet before and after each tool execution. The problem is that once you've sprinkled enough of these, the core logic gets buried under code that has nothing to do with the actual business.
harness9's approach is to add zero new instrumentation points, and instead hang observability off three interfaces that already existed.
Path one: at a handful of key moments during execution (start, start of each turn, end of each turn, end), the engine notifies a listener called EngineObserver. This interface already existed for any external code that wants to know what the engine is doing — OTELEngineObserver simply implements it:
type EngineObserver interface {
	OnInteractionStart(ctx context.Context, sessionID, prompt string) context.Context
	OnInteractionEnd(ctx context.Context, turns int, err error)
	OnTurnStart(ctx context.Context, turn int) context.Context
	OnTurnEnd(ctx context.Context, turn int, hasToolCalls bool)
}
The engine doesn't know who the listener is, or even whether one exists at all — if none is configured, a no-op implementation stands in for it.
Path two: LLM calls go through an interface called LLMProvider, and TracingProvider implements that exact same interface. The real work underneath is still done by the original Provider — TracingProvider just wraps it in a shell that records a Span before and after the call:
func (p *TracingProvider) Generate(ctx context.Context, messages []schema.Message, tools []schema.ToolDefinition) (*schema.Message, *schema.Usage, error) {
	ctx, span := p.tracer.Start(ctx, SpanLLMRequest)
	defer span.End()
	return p.inner.Generate(ctx, messages, tools) // the real work is still done by the original Provider
}
The engine can't tell the difference at all — it's still holding the same interface type, just with a different implementation swapped in behind it at runtime.
Path three: tool execution already has a ToolHook interception mechanism, originally built for scenarios that need to change the outcome of execution — like blocking dangerous commands or requiring permission approval. ObservabilityHook also implements this interface, but it never blocks or modifies anything — it just watches from the side and records:
func (h *ObservabilityHook) BeforeExecute(ctx context.Context, tc schema.ToolCall) (context.Context, hooks.HookDecision, error) {
	ctx, span := h.tracer.Start(ctx, SpanToolExecution, ...)
	return ctx, hooks.Allow(), nil // always allow, purely observational
}
What all three paths have in common: for every "hook" observability needs, harness9 already had an interface sitting right there — originally built for some other purpose. All you have to do is hang your logic on it; there's no need to open a new entry point.
Defining the core Metrics
Spans record "what happened this one time and how long it took"; Metrics record "what the trend looks like over time" — whether token spend has been high over the past hour, whether a tool's recent failure rate has been creeping up. harness9 defines 6 Metrics:
| Metric | Type | Description |
|---|---|---|
harness9.llm.request.duration | Histogram | Duration of a single LLM call |
harness9.llm.tokens.input | Counter | Cumulative input tokens |
harness9.llm.tokens.output | Counter | Cumulative output tokens |
harness9.tool.calls.total | Counter | Number of tool calls |
harness9.tool.execution.duration | Histogram | Duration of tool execution |
harness9.agent.turns.total | Counter | Total number of Agent turns |
The choice of type is straightforward: use Histogram for durations, Counter for totals. Duration data is meaningless if you only look at the average — most requests finish in 2 seconds, but occasionally one takes 20 seconds, and you need to preserve both facts; a Histogram tells you what the distribution actually looks like. For numbers that only ever go up — token consumption, call counts — a simple Counter accumulator is enough.
The two tool-related metrics carry two extra labels: "tool name" and "success or failure":
attrSet := attribute.NewSet(
	attribute.String(AttrToolName, tc.Name),
	attribute.String("tool.status", status),
)
h.toolDuration.Record(ctx, elapsed, metric.WithAttributeSet(attrSet))
h.toolCallsTotal.Add(ctx, 1, metric.WithAttributeSet(attrSet))
Without these two labels, "total number of tool calls" is just a lonely number — you can't tell whether bash is slow or read_file is slow, and you can't tell which tool's failure rate has quietly been rising lately. With the labels attached, that number can be sliced open along each dimension.
Why Langfuse?
Langfuse is an open-source platform purpose-built for observability in LLM applications. General-purpose monitoring platforms (Grafana, Jaeger) were designed for traditional backend services, and look at metrics like HTTP request latency and database query counts; Langfuse is designed specifically around the "LLM application" scenario, and natively understands concepts like "a conversation," "a model call," and "how many tokens were used."
It solves two core problems. First, it turns a single Agent run into an expandable, drill-down timeline — which step called the LLM, what messages were sent, what the model replied, how long each tool execution took, all laid out on one diagram. Second, it computes cost automatically — for every LLM call, how many input tokens and how many output tokens were used, and Langfuse converts that directly into an estimated cost using the model's pricing, without harness9 having to maintain its own pricing table and do the math by hand.
harness9 chose to integrate with Langfuse because it natively supports OpenTelemetry — meaning harness9 only has to emit Spans and Metrics over the standard protocol, without writing a dedicated SDK or adapter layer just for Langfuse. In principle, the same OTEL data stream could be pointed at Grafana or Jaeger instead just by changing the endpoint; it's just that Langfuse's UI is more tailored to the LLM use case.
Langfuse integration details
OTEL itself only specifies "there's a thing called a Span, and it can carry attributes" — what those attribute names are, and what Langfuse does with them, is a private agreement between the two sides. When harness9 reports attributes on a Span, it uses the names Langfuse recognizes.
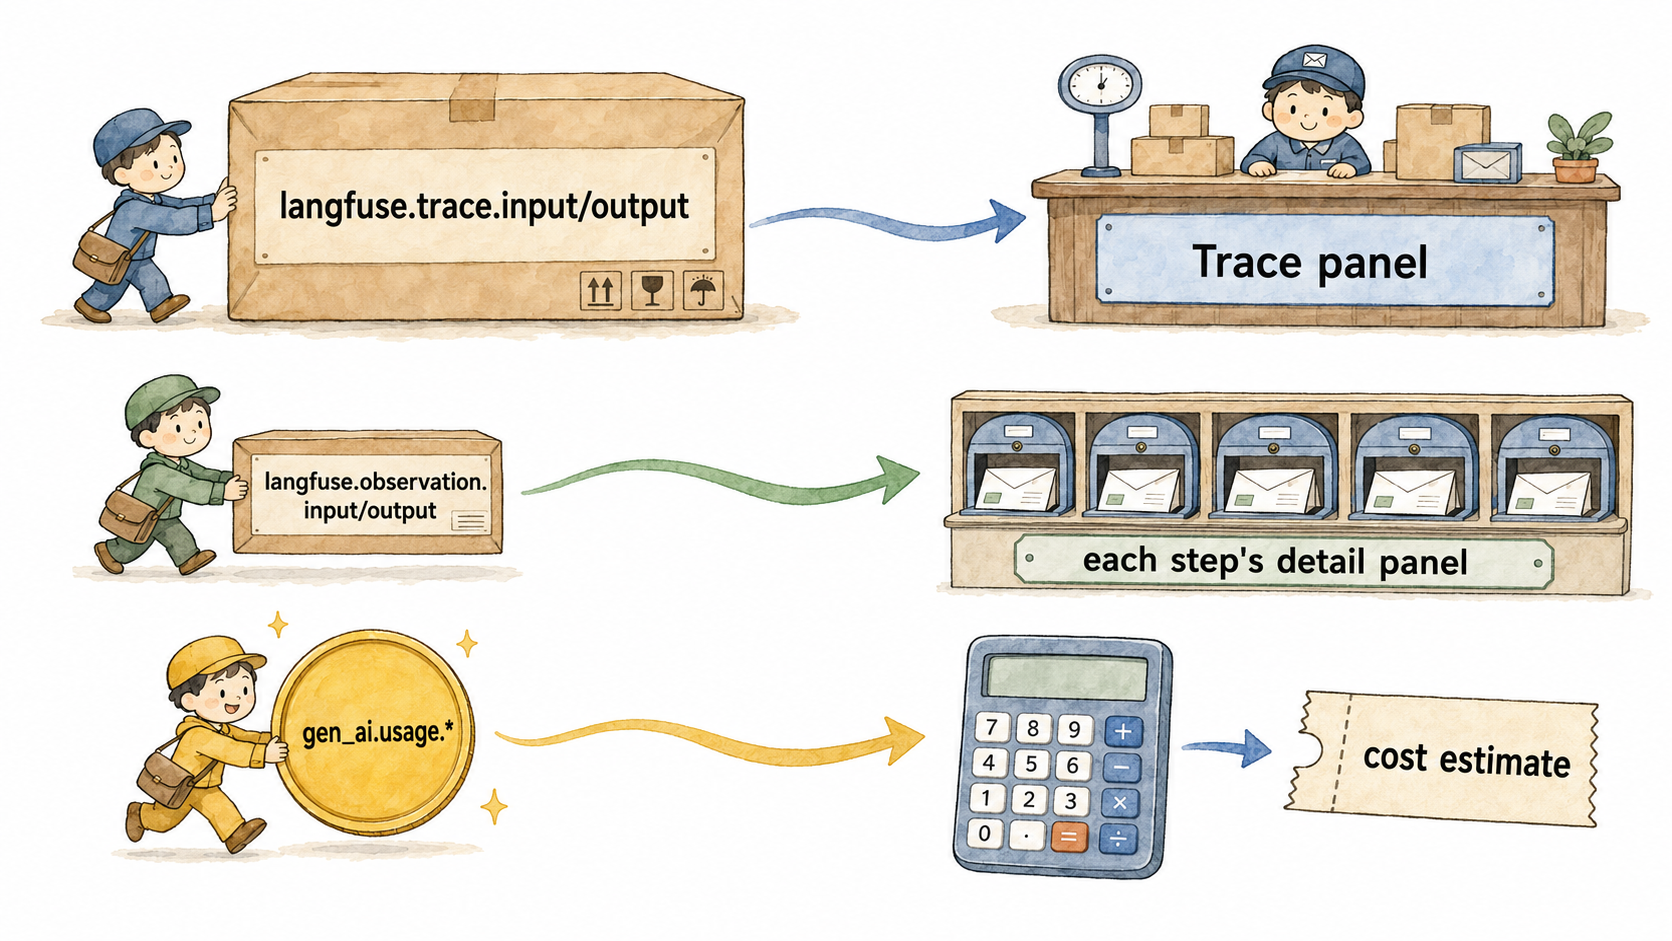
The logic is simple, and there's an easy analogy: it's like shipping a package — you have to clearly label "recipient" and "sender" on the box. Label it correctly, and the sorting center knows where to route it. Get the label wrong, and the package still arrives somewhere, but nobody knows where it's supposed to go.
Specifically, the input/output of "one complete conversation" (i.e. the outermost interaction) must be written as langfuse.trace.input / langfuse.trace.output; while the input/output of "one step within the conversation" (e.g. one LLM call, one tool execution) must be written as langfuse.observation.input / langfuse.observation.output. These two sets of names correspond respectively to the "input/output of the entire Trace" display area and the "input/output of each individual child node" display area in the Langfuse UI. If you take the shortcut of writing everything as the plain langfuse.input/langfuse.output — without the trace/observation qualifier — Langfuse will store those attributes as ordinary metadata, and the area of the UI meant to display that content will just be blank.
Automatic token cost calculation relies on another set of agreed-upon names — gen_ai.usage.input_tokens and gen_ai.usage.output_tokens — which are the standard names OTEL officially defines for "large model call" scenarios. All harness9 has to do is write the actual number of tokens consumed by each call into these two attributes:
span.SetAttributes(
	attribute.Int(AttrGenAIInputTokens, usage.InputTokens),
	attribute.Int(AttrGenAIOutputTokens, usage.OutputTokens),
)
Once Langfuse sees these two attribute names, it knows to run the numbers through the corresponding model's pricing table, and displays a cost estimate like "25,269 prompt → 1,027 completion" — harness9 doesn't have to maintain any pricing logic of its own.
Here's what the resulting Trace dashboard looks like in Langfuse: 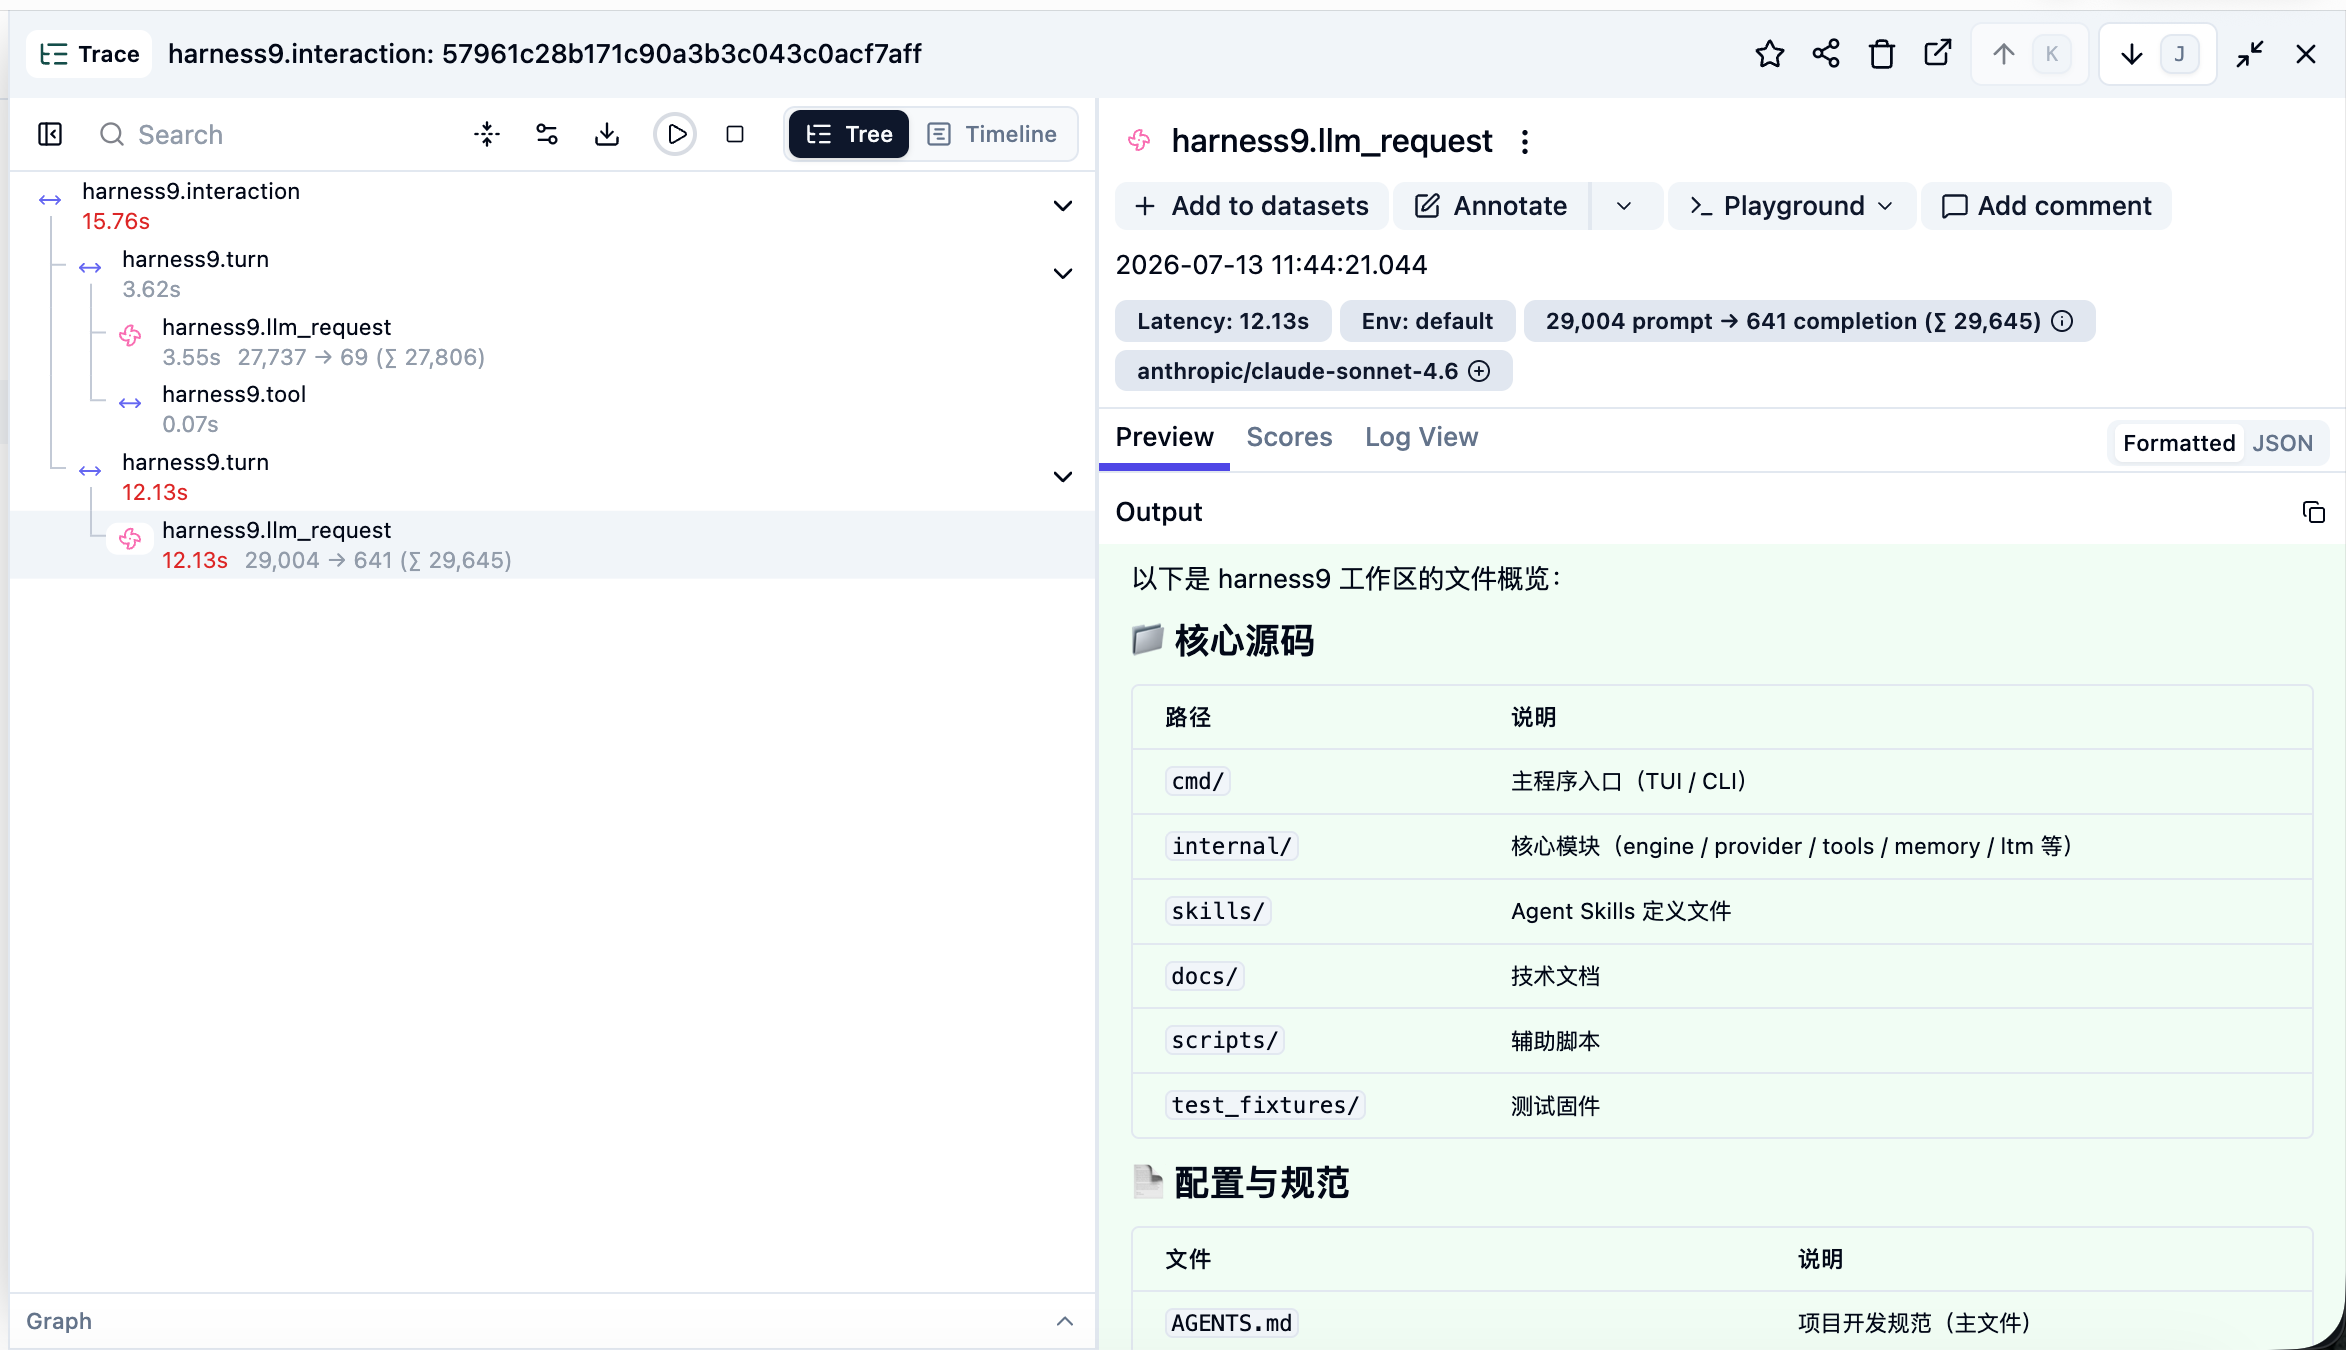
Closing thoughts
The most important thing to remember about harness9's Observability module isn't that it hooks up OTEL or that it hooks up Langfuse — it's that it demonstrates something: giving a system the ability to "see clearly inside itself" doesn't require littering the internals with probes. Find the boundaries that already exist — a listener interface, a decorator layer, a hook — and let the observer hang off that boundary, so the core logic never has to know it's being watched at all. If your system doesn't have boundaries like this yet, maybe the question to ask before adding observability is: shouldn't this layer of abstraction have existed in the first place?